NumaMMa: Numa MeMory Analyzer
NumaMMa is both a NUMA memory profiler/analyzer and a NUMA application execution engine. The profiler allows to run an application while gathering information about memory accesses. The analyzer visually reports information about the memory behavior of the application allowing to identify memory access patterns. Based on the results of the analyzer, the execution engine is capable of executing the application in an efficient way by allocating memory pages in a clever way.
Contact
In case of a problem, don’t hesitate to contact us !
francois.trahay@telecom-sudparis.eu
Output Examples
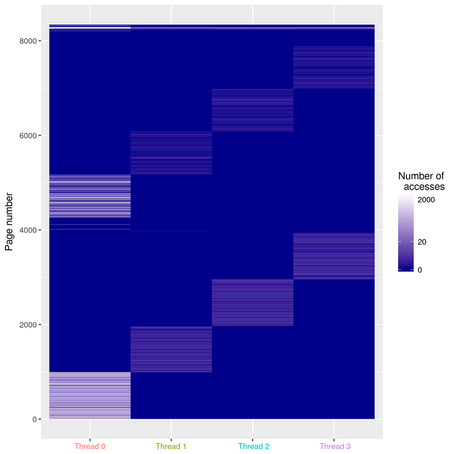
Number of memory accesses, by each thread, to the pages of main_flt_mem in NPB CG
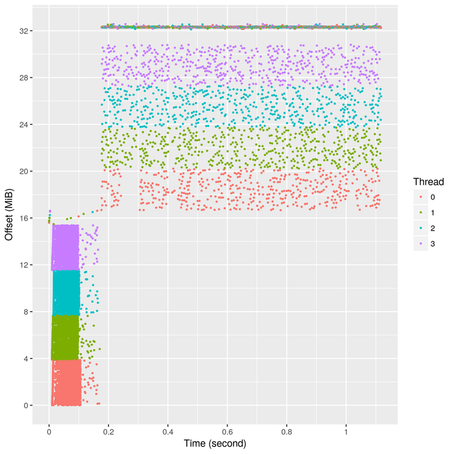
Memory accesses over time, by each thread, to the pages of of main_flt_mem in NPB CG
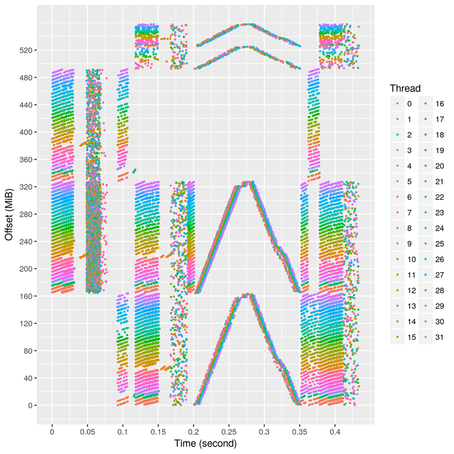
Memory accesses over time, by each thread, to the pages of cvar_ in NPB LU
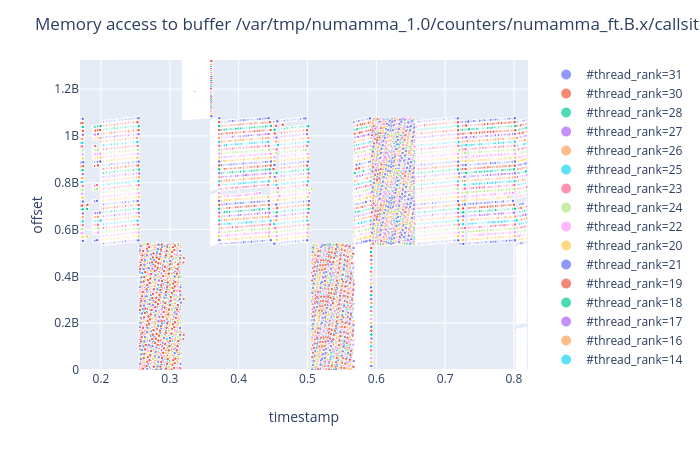
Interactive plot of memory accesses over the time. Each point is a memory access performed by a thread, to the bigarrays buffer in NPB FT
Dependencies
NumaMMa relies on the folowing libraries:
numactlnumapbacktracelibelf
Build
The above dependencies must be installed first. Then NumaMMa itself can be built.
You can also run the install_everything.sh script that installs NumaMMa and its dependencies. You can also run the following commands to download and build NumaMMa with all its dependencies.
Profiling an application
To profile your application with NumaMMa, just launch it through the numamma command installed when NumaMMa has been built:
numamma [options] myappli
numamma gathers information on the memory objects of the application (ie. global variables, or dynamically allocated buffers), and samples the application memory access.
The following options permit to customize how numamma collects data:
-aINTERVALor--alarm=INTERVAL- Collect samples every
INTERVALms (default: disabled)
- Collect samples every
-for--flush[=yes|no]- Flush the sample buffer when full (default: yes)
-ror--sampling-rate=RATE- Set the sampling rate (default: 10000)
-sor--buffer-size=SIZE- Set the sample buffer size (default: 128 KB per thread)
- When the sample buffer is full, numamma stop recording memory access until the buffer is emptied. The buffer is emptied when the application calls an allocation function (eg. malloc, realloc, free, etc.), when the alarm is triggered (if set), or when the buffer becomes full (unless the
--flush=nooption is passed tonumamma)
NumaMMA report
At the end of the execution, NumaMMa reports information about the memory accesses of the application:
-----------------------------------
NumaMMA report:
Analyzing 1214 sample buffers
Analyzing sample buffer 1210/1214. Total samples so far: 74690
2987920 bytes processed
---------------------------------
         MEM ANALYZER
---------------------------------

# --------------------------------------
# Summary of all the read memory access:
# Total count          :         7293
# Total weigh          :         58039
# L1 Hit        : 7293 (100.000000 %)   min: 7 cycles   max: 14 cycles   avg: 7 cycles  total weight: 58039 (100.000000 %)

# --------------------------------------
# Summary of all the write memory access:
# Total count          :         67405
# Total weigh          :         0
# L1 Hit        : 67101 (99.548995 %)   min: 0 cycles   max: 0 cycles    avg: 0 cycles  total weight: 0 (0.000000 %)

Summary of the call sites:
--------------------------
Sorting call sites
1       [stack] (size=412316860415) - 1 buffers. 4863 read access (total weight: 34953, avg weight: 7.187539). 3482 wr_access
4       /home/trahay/Soft/opt/numamma/test/mat_mul.c:78(main) (size=800) - 100 buffers. 608 read access (total weight: 7904, avg weight: 13.000000). 62016 wr_access
5       /home/trahay/Soft/opt/numamma/test/mat_mul.c:68(main) (size=800) - 1 buffers. 608 read access (total weight: 4256, avg weight: 7.000000). 0 wr_access
2       /home/trahay/Soft/opt/numamma/test/mat_mul.c:70(main) (size=800) - 2 buffers. 0 read access (total weight: 0, avg weight: 0.000000). 608 wr_access
3       /home/trahay/Soft/opt/numamma/test/mat_mul.c:74(main) (size=800) - 2 buffers. 0 read access (total weight: 0, avg weight: 0.000000). 608 wr_access
74698 samples (including 1905 samples that do not match a known memory buffer / 2.550269%)
Output directory: /tmp/numamma_trahay
Additionally, numamma also generates files in the /tmp/numamma_$USER directory. To control which files are generated, several options are available:
- by default,
numammageneratescall_sites.logthat lists the application memory objects as well as memory access statistics on them. Each line starts with the call site ID. For example:
3       /home/trahay/Soft/opt/numamma/test/mat_mul.c:74(main) (size=12000) - 160 buffers. 5498814 read access (total weight: 1305315950, avg weight: 237.381361). 40590 wr_access
4       /home/trahay/Soft/opt/numamma/test/mat_mul.c:78(main) (size=12000) - 339 buffers. 5818196 read access (total weight: 1088387205, avg weight: 187.066095). 14656019 wr_access
5       /home/trahay/Soft/opt/numamma/test/mat_mul.c:76(main) (size=12000) - 1 buffers. 10830555 read access (total weight: 80991250, avg weight: 7.478033). 0 wr_access
2       /home/trahay/Soft/opt/numamma/test/mat_mul.c:70(main) (size=12000) - 38 buffers. 6873841 read access (total weight: 58451985, avg weight: 8.503540). 40590 wr_access
6       /home/trahay/Soft/opt/numamma/test/mat_mul.c:72(main) (size=12000) - 1 buffers. 6453238 read access (total weight: 52071167, avg weight: 8.068998). 0 wr_access
7       /home/trahay/Soft/opt/numamma/test/mat_mul.c:68(main) (size=12000) - 1 buffers. 6836348 read access (total weight: 48885993, avg weight: 7.150893). 0 wr_access
1       [stack] (size=412316860415) - 1 buffers. 1819616 read access (total weight: 14471352, avg weight: 7.952970). 4946 wr_access
- by default,
numammaalso generates an access summary file (namedcallsite_counters_<ID>.dat)for each call site. For example,callsite_counters_3.datcontains the access summary for the callsite3(mat_mul.c:74(main)):
        58570   0       5352336 58
        58570   0       0       0
        27042   0       42828   0
-
this file contains the number of memory accesses to an object. Each line contains the accesses to a page within the object (assuming 4KiB pages), and the columns corresponds to the differents threads.
-
-dor--dump- Dump the collected memory access (default: disabled)
- When this option is enabled, numamma reports in
callsite_dump_<ID>.datall the samples collected for each call site. For instance:
#thread_rank timestamp offset mem_level access_weight
0 14087247746057 5864 L1_Hit 0
0 14087248615826 3872 L1_Hit 0
0 14087249526638 1888 L1_Hit 0
0 14087250387561 7912 L1_Hit 0
0 14088660667040 5776 L3_Hit 50
0 14088923322555 6376 L2_Hit 46
- In this file, each line corresponds to a sample
thread_rankis the thread that performed the memory accesstimestampis the date at which the memory access occuredoffsetis the part of the memory object that was accessedmem_levelis the part of the memory hierarchy that was accessedaccess_weightis the ‘cost’ of the memory access. This is (more or less) the number of CPU cycles that were required for this memory access
- When the
-doption is enabled, numamma also writes a summary of the memory access to a memory object incallsite_summary_<ID>.dat. For example:
# --------------------------------------
# Summary of all the read memory access:
# Total count          :         6265665
# Total weigh          :         499271856
# L1 Hit        : 44461 (0.709597 %)    min: 0 cycles   max: 0 cycles    avg: 12 cycles total weight: 533532 (0.106862 %)
# L2 Hit        : 336434 (5.369486 %)   min: 0 cycles   max: 0 cycles    avg: 37 cycles total weight: 12716280 (2.546965 %)
# L3 Hit        : 5094515 (81.308449 %)         min: 0 cycles   max: 0 cycles    avg: 61 cycles total weight: 311692351 (62.429385 %)
# LFB Hit       : 43375 (0.692265 %)    min: 0 cycles   max: 0 cycles    avg: 152 cycles        total weight: 6593000 (1.320523 %)
# Local RAM Hit : 746880 (11.920203 %)  min: 0 cycles   max: 0 cycles    avg: 224 cycles        total weight: 167736693 (33.596264 %)

# --------------------------------------
# Summary of all the write memory access:
# Total count          :         12040
# Total weigh          :         0
# L1 Hit        : 12040 (100.000000 %)  min: 0 cycles   max: 0 cycles    avg: 0 cycles  total weight: 0 (0.000000 %)
-mor--match-samples[=yes|no]- Match samples with the corresponding memory object (default: yes)
- By default, numamma tried to find the memory object that corresponds to each collected sample. This option can be used in order to reduce the analysis cost.
-oor--outputdir=dir- Specify the directory where files are written (default: /tmp/numamma_$USER)
--online-analysis- Analyze samples at runtime (default: disabled)
- By default, the samples are stored in buffers at runtime, and analyzed at the end of the application. This may cause numamma to allocate a lot of memory for storing samples.
- When this option is enabled, the samples are analyzed at runtime and are not stored. This prevents numamma from allocated to much memory, but this increases numamma overhead at runtime.
-uor--dump-unmatched- Dump the samples that did not match a memory object (default: disabled)
- When this option is enabled, numamma writes the addresses that did not match any memory object in
unmatched_samples.log.
Plotting data
The data produced by NumaMMA at runtime can be plotted using R scripts:
plot_pages_matrix.R- this script takes a
callsite_counters_X.datas a parameter and generates a matrix plot that represent the number of memory access that each thread issued to each pages of an object Usage:plot_pages_matrix.R callsite_counters_1.datgeneratescallsite_counters_1.dat.png
- this script takes a
plot_timeline- this script takes a
callsite_dump_X.datfile as a parameter and generates a timeline plot. Example of usage: `plot_timeline -i callsite_dump_1.dat -o callsite_dump_1.png
- this script takes a
plot_interactive_timeline.py- this script takes a
callsite_dump_X.datfile as a parameter and generates an interactive timeline plot. - Example of usage: `plot_interactive_timeline.py [-o output.html] callsite_dump_1.dat
- Example of output
- this script takes a
Content of this repository
src folder
libnumama
mem_intercept.c- This file contains overload of
pthread_createfunction to start sampling for the thread created. This is done by call toma_thread_init. - This file contains overload of memory allocation functions,
mallocand co to log the accesses by calls toma_record_mallocandma_update_buffer_addressandma_record_freefunctions;
- This file contains overload of
mem_tools.c- This file contains function to do something with the backtrace lib. To retreive some information.
mem_sampling.c- Provides functions to start / stop mem sampling.
mem_analyzer.c- The main file gluing together all the other ones.
numamma.c- This file implement the launcher. It checks the options and sets a few environment variables before executing the application.
libnuma_run
mem_run.c- This file intercepts calls to pthread/memory functions and modifies their behavior. For instance, it can apply a binding policy on the memory (possibly different binding policies for several objects). [Experimental/buggous].
tools folder
libnumamma-tools
The file hash.c is compiled into a shared library
libnumamma-tools.so. This file provides functions to create and
manipulate a has map.
Presentations
There has been several presentations of NumaMMA during conferences or seminars. Here are the corresponding slides:
- NumaMMA memory profiler. Presented during the Inp@ct seminar at Ter@tec in 2019.
- NumaMMA memory profiler. Presented at ICPP 2018